
Hey there,
Welcome to another round of The Advantage Hit 📨 - where we spill inbox secrets that drive real conversions!
There’s a sentence we hear in every onboarding call:
“We need to send more. Our calendar feels light.”
In 2023, that instinct was right. Inbox space was generous, fatigue triggers were predictable, and one extra campaign a week usually paid for itself. In 2026, the same instinct is the single most expensive reflex in your retention program.
The math has flipped. And almost nobody is pricing it in.
The agency move: Stack the campaign calendar. Bill the hours. Ship the sends. Tell the brand “we’re being aggressive.”
The Partner move: Pull the data. Plot revenue per send against weekly frequency. Find the cliff. Pull back.
Today we’re doing the Partner move.
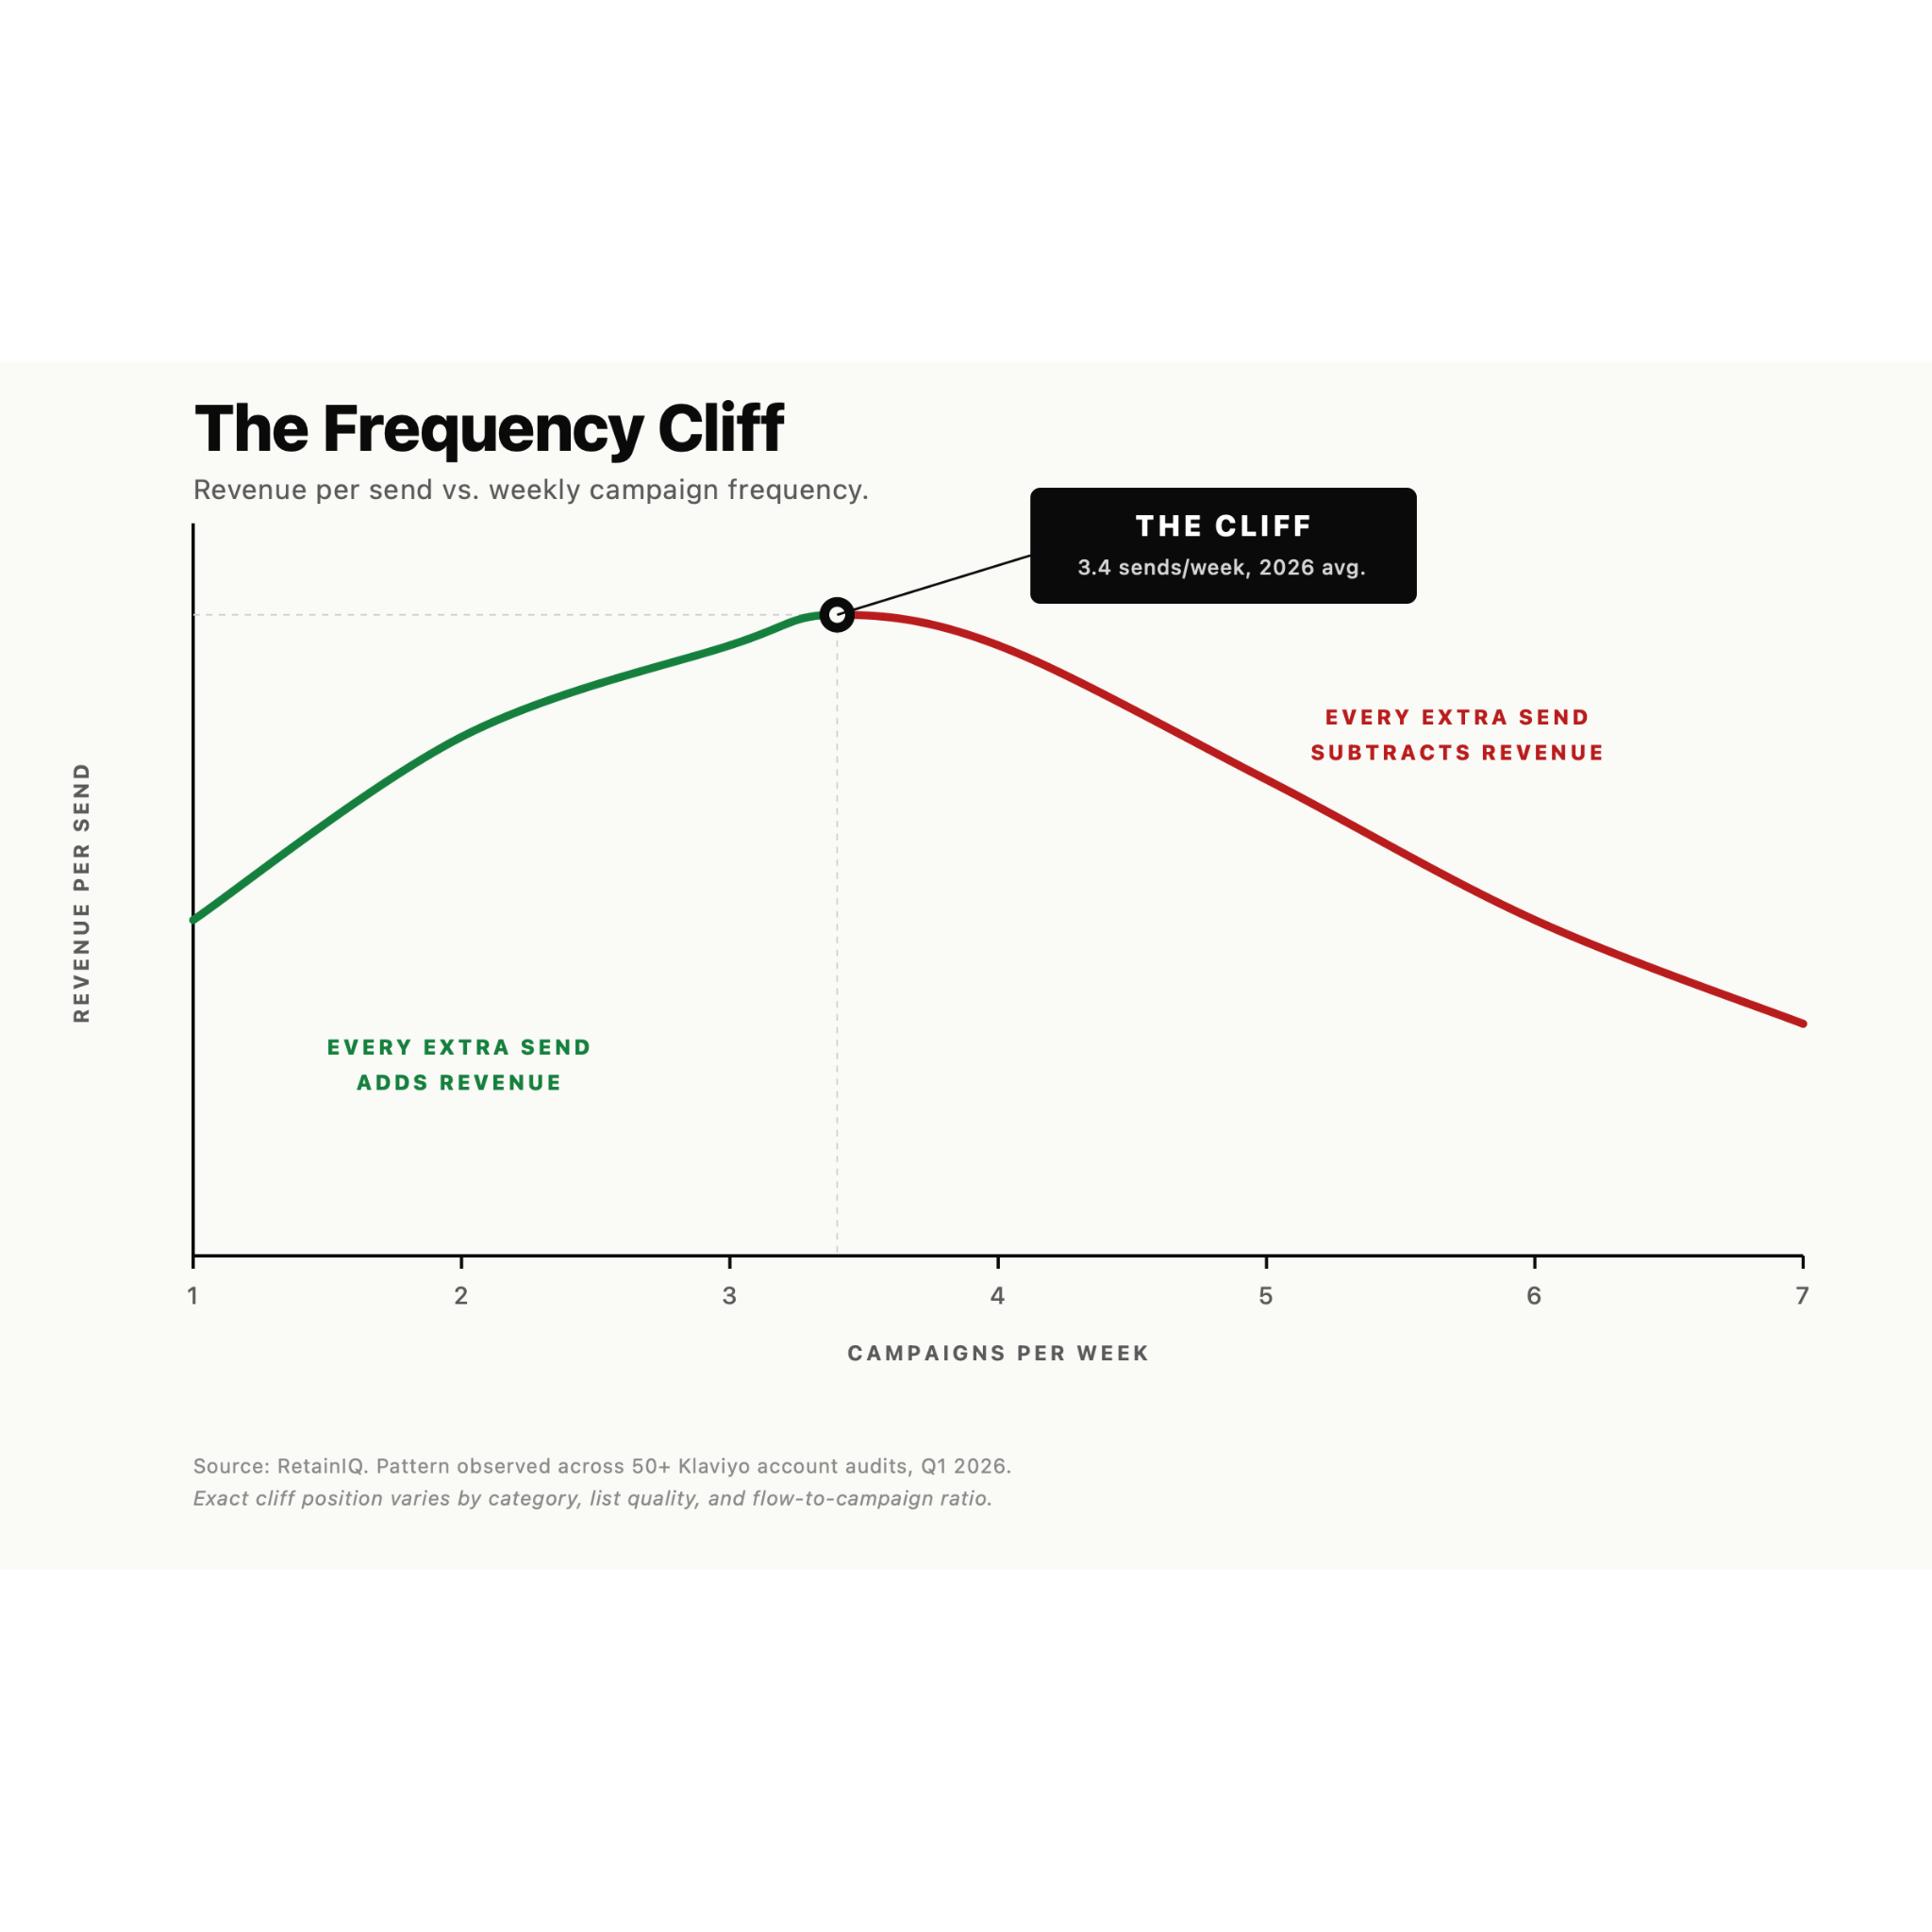
The Frequency Cliff: a problem with a name ⚠️
The Frequency Cliff is the point in your weekly send schedule past which every additional campaign subtracts total revenue, not adds to it. In 2023, that cliff sat around 5 to 6 sends a week for most D2C categories. In 2026, we’re seeing it consistently land at 3.4 sends a week across the accounts we audit.
Three things in 2026 moved the cliff closer:
1. Inbox space contracted.
Gmail’s Promotions tab volume is up roughly 40% year over year. The shelf is more crowded. Your fifth campaign of the week is no longer “another touchpoint.” It’s the seventeenth promotional email your customer has seen since Tuesday morning.
2. Apple MPP broke your fatigue triggers.
The classic Klaviyo “engaged in last 30 days” sunset logic was built on real opens. Now half your “engaged” segment is Apple’s privacy proxy auto-opening on their behalf. You’re sending more email to people who haven’t actually looked at any of it. Frequency-based fatigue rules can’t see them anymore.
3. The subscriber expectation shifted.
The under-35 buyer wants a signal, not a stream. The brands they trust send less and say more. The brands that send daily are getting filtered, foldered, or unsubscribed inside 21 days.
The 3 Symptoms of being past the Cliff 📉
Symptom #1: Revenue per send is falling while total revenue stays flat.
You added a Wednesday campaign. Revenue looks “the same.” That’s not a tie. That’s a loss. Your revenue per send dropped, your unsub rate ticked up, and your list aged faster. You’re paying for that Wednesday with future Tuesdays.
Symptom #2: Unsubscribe rate quietly above 0.25%.
Healthy is 0.10 to 0.18%. Anything above 0.25% on campaigns is a frequency problem dressed up as a relevance problem. The copy team gets blamed. The copy is fine. The cadence is the killer.
Symptom #3: Your top performer is always the same recurring slot.
If your “Sunday digest” out-earns every other send by 2 to 3x, your audience is telling you they want one email a week, not five. Most brands ignore the signal and add a Monday teaser. The Monday teaser cannibalizes the Sunday revenue.
A Case Study: How fewer sends bought a 19% lift 📈
We onboarded a wellness brand last quarter doing roughly $280K/month, running 6 campaigns a week plus flows. The CMO’s instinct was that the list was tired and they needed more creative variety to fix it.
The numbers told a different story:
Open rate trending down: 41% → 33% over 90 days
Click rate: 1.8% → 0.4%
Unsubscribe rate: 0.21% → 0.45%
Revenue per send falling 11% month over month
The list wasn’t tired. The list was over-served.
What we actually did:
Cut campaigns from 6/week to 3/week. A 50% reduction in volume. The CMO’s exact words: “this feels reckless.”
Re-allocated the saved capacity into flows. Built a real replenishment flow, rebuilt browse abandonment, added a 14-day post-purchase sequence with no discount.
Anchored the weekly cadence around one “anchor send.” Tuesday 10am, plain-text, from a personal name, no header image. The other two sends of the week had to earn their slot against the anchor.
Killed the “filler” campaign category. No more Friday “weekend vibes” sends with no real news. If we didn’t have something to say, we didn’t send.
The Result after 60 days:
Total revenue: up 19%
Revenue per send: up 2.4x
Unsubscribe rate: 0.34% → 0.09%
Click rate: 0.4% → 1.65%
Flow revenue share: 31% → 47%
We did less. The list earned more. The CMO stopped sending us “but should we add a Wednesday send?” Slack messages.
THE 2026 REALITY: THE ATTENTION COMPOUND
Here’s the part the calendar-stacking agencies refuse to internalize.
Attention is the only asset on your balance sheet that compounds when you don’t spend it. Every send you skip when you don’t have something real to say is a deposit. Every send you push out to “stay top of mind” is a withdrawal.
Brands that hit a 3.4 sends-per-week ceiling and held it for 12 weeks consistently see compounding RPS gains. The list believes them when they show up. The opens stay real. The clicks stay real. The placement stays Primary.
Brands that send 5 to 7 times a week burn the deposit faster than they can replace it. They look busy. They are quietly going broke on the unit economics of email.
The one thing worth doing this week
Open your last 30 days of campaign data. Add up the total attributed revenue. Divide by the number of sends. That’s your real revenue per send right now.
Do the same for the 30 days before that. And the 30 days before that.
If your RPS is sliding while your weekly send count is climbing or holding flat, the cliff is already inside your calendar.
Then run a second check. Pull the segment of subscribers who were active 90 days ago and have gone silent in the last 30. The size of that segment is the size of the leak. Most brands have never opened that report. The number is usually large enough to ruin your week.
You’ll see the symptom clearly. What you won’t see is where the cliff sits for your specific list, your category, your seasonality, and your flow-to-campaign ratio. That number is account-specific, and cutting at the wrong point in the calendar is just as expensive as not cutting at all.
Reply and tell us: how many campaigns a week are you running right now? We’ll send back our honest read on whether you’re past the cliff.
If your dashboard is telling you “everything is fine” but your revenue per send keeps slipping, that’s the cliff in action. We’re seeing this exact pattern across supplements, beauty, apparel, and home goods accounts in the last 90 days. It’s not category-specific. It’s structural.
50+ audits this year. We know what the Frequency Cliff looks like in the numbers, and we know the exact operational lift it takes to climb back.
Reserve a Quick Frequency Audit at $0
15 minutes. Your real Klaviyo data. Our honest read on whether your calendar is helping or leaking.
A Klaviyo Gold Master Partner Agency, driving success for D2C brands starting at just $990/month. (No Retainer)

